


Loneliness and The Apocryphal Fifteen Cigarettes
Lies, damned lies, and statistics. The story behind a falsehood propagated to the highest medical authority in the country.


“Loneliness is as deadly as smoking 15 cigarettes a day.”
Anyone vaguely familiar with the epidemic of loneliness has likely heard several iterations of this phrase, a slogan seemingly designed to elevate loneliness to the redoubtable status that smoking enjoys in the public consciousness. But like many a good slogan, it also suffers from being fundamentally untrue. And unlike the notoriously false “eating eight spiders in a lifetime while sleeping” that The Washington Post reported as being fabricated by a 1999 article from The Guardian, this specious claim originated at the highest levels of the scientific community.
U.S. Surgeon General Vivek Murthy has made no secret that his office is waging a crusade against loneliness, issuing and the 82-page advisory, Our Epidemic of Loneliness and Isolation, last May. And like his predecessor and successor Jerome Adams’ relationship with substance abuse, loneliness is a deeply personal issue for Murthy, whose had his own struggles with the condition following the end of his first term as Surgeon General in April of 2017.
Later that year in September, Murthy would go on to write an article published in Harvard Business Review, titled “Work and the Loneliness Epidemic”, where he discloses his burgeoning awareness of loneliness as a large-scale issue:
Chances are, you or someone you know has been struggling with loneliness. And that can be a serious problem. Loneliness and weak social connections are associated with a reduction in lifespan similar to that caused by smoking 15 cigarettes a day and even greater than that associated with obesity. But we haven’t focused nearly as much effort on strengthening connections between people as we have on curbing tobacco use or obesity.
The work done to establish the 15 cigarettes a day was not established by Murthy or his office, so where does that number come from? Following the link Murthy provides leads you to a 2010 meta-analytic review by Julianne Holt-Lunstad, Timothy B. Smith, and J. Bradley Layton, with Holt-Lunstad and Smith listed as the primary contributors
As a quick aside, loneliness is both a term that refers to the general field of social connection and relationships as well as a specific qualitative measure that gauges an individuals perception of social relationships and connection. Social connection, a quantitative measure, has effectively become the de facto proxy for what news outlets and public officials often mean when they say “loneliness”.
Meta-analyses often consist of consolidating multiple studies to and integrating them into a single set of results. They can often be difficult to handle considering the accommodations that need to be made for variations in study scope, methodology, and publication bias. The work done by Holt-Lunstad et al. in that review parses 148 studies across multiple facets of social connection. The 15 cigarettes themselves arise from discussion figure comparing the odds of mortality between the results of their own meta-analysis with results from other meta-analyses with different treatments.
One of the common ways is to represent mortality is with the odds ratio (OR). The log-transformation, often done to normalize data, was likely done in this figure to make it more visually appealing by clustering the numbers while preserving symmetry and ordering. In this case, the authors took the natural logarithm of the odds ratio (lnOR). For those unfamiliar with the odds ratio and properties of the log-transformations, a brief primer/refresher is available here1.

From the results of Holt-Lunstad et al., the OR from all 148 studies averaged out at 1.50, whose natural logarithm corresponds to the 0.405 graphed in the first line of the figure. But the lnOR for the 15 cigarettes is clearly represented as north of 0.5 and the confidence intervals don’t overlap either, so how could you conclude from this figure that lacking social connection is overall deadlier than smoking 15 cigarettes a day? You can’t, that’s the problem.
Also pictured at the top of the figure are the lnOR of specific measures of social connection, most notably the complex measures of social integration, whose OR of 1.91 from Table 4 of the article corresponds to the lnOR of 0.647, the largest statistic on display. Now this is greater, and hence deadlier, than the effect from 15 daily cigarettes, but what do “complex measures of social integration” entail?
One of the challenges with conducting a meta-analysis for conditions as broad as social connection is that it is unlikely for every study to focus on the same aspect of social connection using the same measure. Holt-Lunstad et al. divided the studies largely into functional, effective support from social connections, and structural, the types of relationships and their activity levels, groups. Structural elements in the 2010 review include martial status, social network size, and social participation amongst others, with “complex measures of social integration” looking at the aforementioned three all together.
While you can argue that a three-dimensional measure is better than a one-dimensional measure, the “complex measures of social integration” is not sans caveats. One can buttress the loneliness of a lack of a partner/spouse with strong friendships or vice versa, but to lack both could obviously exacerbate any debilitating effects. And logically, you can easily imagine how somebody who has no partner, unfulfilling friendships, and only a few of those to boot, has a greater disposition to loneliness than someone who only lacks one of the three components, explaining why the measure has the highest lnOR. But all three of those aren’t necessary for someone to be lonely since only one of those conditions, or none at all, is strictly sufficient.
So is the takeaway from this figure simply just that smoking 15 cigarettes a day is not worse than lacking social connection overall, but still better than the most severe instances of lacking social connection? It might feel like this is a simple misspeak being overblown, but if so, then why has nobody noticed it in the near decade and a half its been published? And if so, then why do subsequent publications further propagate this erroneous conclusion?
In a 2017 article by Holt-Lunstad, Theodore Robles, and David Sbarra titled “Advancing Social Connection as a Public Health Priority in the United States”, that 2010 discussion figure appears once more, albeit this time repurposed with a bit of a visual makeover.

While there are some compositional changes, such as dropping the hypertension and cardiac rehabilitation studies for more sociality studies, and swapping out the old obesity study for a new one — in the 2010 figure they double-dipped by using the same meta-analysis for the effects of both physical activity and obesity — the figure largely remains unchanged except for it now being fully ordered by magnitude and the addition of a neat legend delineating between other health conditions and social connection, the quantitative counterpart to evaluate the more qualitative loneliness.
In this figure it’s even more explicit that those 15 daily cigarettes are worse than social connection on average. Of additional note is the the statistic correlated by [G], which comes from a 2015 meta-analysis on loneliness spearheaded by Holt-Lunstad, featuring the returning Timothy Smith, as well as introducing new co-authors Mark Baker, Tyler Harris, and David Stephenson. Here they looked across 70 studies at the effects of social isolation, loneliness, and living alone on mortality, reporting respective ORs (and by extension lnORs) of 1.29 (0.255), the featured 1.26 (0.231), and 1.32 (0.278). All of these results are still significantly less than the smoking statistic, falling more in line with the 2010 average.
While the 2017 figure may seem unremarkable since it largely echoes the 2010 figure, it’s importance lies in its legacy. When Vivek Murthy published that 2023 advisory on loneliness, his team adapted the 2017 rendition. See if you can spot the changes.

This 2023 iteration features a significant paring of the meta-analysis, some that deserved to be cut, like the flu vaccine statistic for its absolutely disgusting confidence interval, and others that didn’t. Because gone are all the other representations of loneliness, with “Complex measures of social integration” being left as the one indicator to rule them all. And to simply slap “Lacking Social Connection” over it as if the existing overall average didn’t exist is wholly deceitful.
If you were to be given this figure alone without any knowledge of the two figures that came before you would conclude that lacking social connection is worse than smoking up to 15 cigarettes daily and rightly so, but incorrectly so. And incorrectly through no fault of your own but because you’ve been misled by misrepresented data that eschewed all other data that conflicted with the notion that loneliness is the deadliest of conditions.
And by now maybe you’ve also noticed that, if not from the previous paragraph or giant text on the previous figure, the description of the smoking meta-analysis actually reads “Smoking < 15 cigarettes a day,” which is not the same as the expected “Smoking 15 cigarettes a day” that was reported in The Guardian, The New York Times, Forbes, The Washington Post, Inc., and Salon, in addition to many other beloved publications. In articles written by journalists who can interpret < as the less-than sign because they actually passed Grade 5 mathematics, they correctly recite the finding as “smoking up to 15 cigarettes”. This clearly isn’t a requirement to be in the employ of the Office of the U.S. Surgeon General because in the figure they also drop the > sign for the abstinence vs. > 6 alcoholic drinks a day meta-analysis, creating an even greater false equivalency and misrepresentation than had they known what the greater-than sign is. The Washington Post in particular get a special shoutout for stealth editing “15 cigarettes” to “up to 15 cigarettes”.

Because up to 15 cigarettes doesn’t mean 15 cigarettes, it actually means anywhere between 0 and 15 cigarettes. After all, the average amount of cigarettes smoked per day can be a rational number since some smokers don’t consistently smoke the same number of cigarettes each day. And so both the smoker who consumes 104 cigarettes a week and the smokers who consumes only one would both be subsumed into the up to 15 cigarettes a day demographic. But as with the figure published in the 2023 advisory, the rationally correct interpretation becomes undone when you pull back the veil of chicanery.
The heart of this matter lies in the smoking meta-analysis sourced by Holt-Lunstad et al., in which authors Robert M. Shavelle, David R. Paculdo, David J. Strauss, and Scott J. Kush who investigated the effect of smoking on mortality across 15 studies in light, medium, heavy, and former smokers. As mentioned prior one of the challenges of meta-analyses are that intra-study variations make inter-study comparisons difficult. Because of this, Shavelle et al. made executive decisions as to which results of each study corresponded to which type of smoker.

Here, mortality is represented by RR, relative risk or risk ratio, which is not the same as the odds ratio2. While the OR can approach the RR instances where the outcome of focus has a low incidence rate, the OR is largely greater than the RR in all other scenarios. A benchmark threshold for when the OR approximates RR is when the outcome rate is roughly ≤ 10%. A more thorough and definitive explanation of the differences between OR and RR can be found here.

Going back to the 2010 Holt-Lunstad et al. figure with the knowledge that things are not always as they seem, investigation into the other meta-analyses listed actually reveals that that the majority of those listed report RR, not OR. Some, like the cardiac rehabilitation meta-analysis do give their results in OR, but others like the air pollution, aforementioned exercise/obesity, alcohol consumption, and smoking meta-analyses give RR. Does Holt-Lunstad et al. make this distinction anywhere in the 2010 paper? No, they appear to have just coerced RRs to ORs and graphed them as if they were lnORs.
The RRs and corresponding lnORs presented for the air pollution, exercise/obesity, and alcohol consumption studies are 1.06 (0.0583), 1.24/1.23 (0.215/0.207), and 1.37 (0.315) respectively, lining up with the values displayed in the figure. The consequence of this coercion is that the RRs transformed to lnORs are likely underrepresenting their mortality rates, which in turn exaggerates the extent to which loneliness, and the other conditions reported in OR, are deadlier than the conditions reported with RR. This is especially relevant in the meta-analyses where the outcome rate appears to be well beyond 10%, such as with the alcohol consumption review. While Holt-Lunstad et al. did indicated in their methods the use of the Comprehensive Meta-Analysis software to transform various effect size metrics, this does not seem to apply to the RR.
However, the one study where this RR coercion does not appear to be present, at least initially, is in the smoking meta-analysis. Coerced RRs of the weighed averages for light and medium smoking equate to 1.50 (0.405) and 2.02 (0.703) respectively, with the lnORs being either too low or too high to match what was graphed in the figure. And this is taking the higher end of the the light smoking average by ignoring the slightly lower male RR. So what data could Holt-Lunstad et al. have used to calculate their “smoking < 15 cigarettes daily” statistic?
In their appendices of the smoking meta-analyses, Shavelle et al. outlined different bounds for light smoking as depending on the study, with cigarettes smoked per day being represented as 1-9 in eight studies, 1-14 in five studies, or 1-19 in one study. The Hozawa 2004 study was not given a light group and instead it appears that Shavelle et al. extrapolated those light smoking RRs.
Now if your aim was to honestly portray the data as it was produced, you might just have taken a sex-weighed average of the light smoking and graphed that. Doing so gives you a lnOR slightly below 0.405, the result for the overall findings from the 2010 meta-analysis. Only problem is that you might have to conservatively list that finding as “smoking up to 9 cigarettes daily”, which doesn’t sound nearly as impressive as 15. But to to get to 15 you would have to cut out all the 1-9 and 1-19 studies to focus on just the 1-14 studies.
1-14, not 1-15.
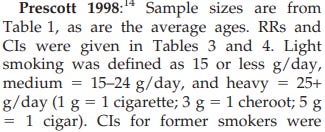
In Shavelle et al. the bounds for light smoking are explicitly stated to be 1-14, with the five studies measuring it being Prescott 1998, Al-dalaimy 2001, Lam 2001, Bronnum-Hansen 2004, and Doll 2004. While Shavelle et al. describes light smoking in the methods and from Prescott 1998 as being 15 or less cigarette equivalents per day, they do so erroneously. a cursory look into the Prescott 1998 article reveals that they grouped it as 1-14. 15 serves as the lower bound for medium smoking in these studies, not as the upper end of light smoking.

The significance of this is that it means that the number 15 is a deliberate conjuring from the æther. There was a purposeful choice made to use the number 15 in Holt-Lunstad et al. and further iterations of the data despite the fact that Shavelle et al. state represent light smoking as up to 14 cigarettes.
Obviously representing it as “up to 15 cigarettes” exaggerates the perception of magnitude greater than saying “up to and including 14 cigarettes”, clearly evinced by the number of articles that straight up ignored the < sign. And sure if you went from < 15 to ≤ 14 you would still probably have journalists unfamiliar with the less-than-or-equal-to sign reporting it as “14 cigarettes a day”, but at least it would be within the observed range. Given that it seems like such a small distinction makes it particularly peculiar to repeatedly lie about. But there are still worse lies yet to be untold.

Taking a sex-weighed averaged of the five 1-14 studies reveals an OR and lnOR of 1.63 and 0.488 respectively, which is still less than what is graphed in the 2010 discussion figure. But if you drop the Bronnum-Hansen 2004 study, the study in the 1-14 group with the lowest RRs, you obtain a sex-weighed average OR of 1.69, with a lnOR of 0.528, seemingly comporting perfectly to the statistic shown in the figure3.
The Bronnum-Hansen 2004 study did not report RRs stratified by sex, so what Shavelle et al. did to remedy this is they evenly divided the samples between male and female. Now if you were trying to measure the differences in how smoking affects mortality across sex, you would probably be better off excluding a study that didn’t distinguish between sex than to feed it into the binomial distribution. That being said, poor disaggregation of data is immaterial when the sex-weighed average looks at aggregated data, so there really is no good reason to exclude the study unless you wanted to increase the average4.
Granted that this is just speculation, insofar as to the possible methodology behind calculating the lnOR. But it is clear that number does not seem to come from the final results as published in Shavelle et al. as is. Abject data manipulation occurred here and there’s no way around that.
And again, as with the RR coercion, there is no mention of this study cherry-picking anywhere in the 2010 Holt-Lunstad et al. article, never mind in the legend of the figure, creating a need for speculation to justify the number’s existence. Now when the 2017 iteration of the figure introduced new studies that measured mortality with hazard ratios (HRs), that figure took care to delineate between HR and OR. Why Holt-Lunstad et al. didn’t do the same for the older meta-analyses that measured RR is unknown, especially since this figure was placed in the discussion section of the paper.
The discussion is typically reserved for space to opine on the implications of the results, the area of the paper where the data processing occurs. Bringing in outside statistics for a figure is one thing, but tacitly making new calculations from other studies and putting that in the discussion seems blasphemous. If this was all known at the time of publication it seems unlikely that this section should have passed the guidelines in 2009 at PLoS Medicine.
“Loneliness is as deadly as smoking 15 cigarettes a day.”
From the blatant graphical misrepresentation all the way at the top in advisory to the invention of the number 15 four studies deep, and all the number cheating in between, this mistruth is rotten all the way through. And now that the falsehood is known, the question arises as to how it could have gone unknown for nearly a decade and a half.
Perhaps, this can all be explained away by human folly; a series of honest mistakes. Maybe a miscommunication cut out all other measures of loneliness out of the advisory figure except for the highest. Maybe OR accidentally got confused for RR across several studies. Maybe whoever went over the smoking meta-analysis only read the erroneous description of 15 cigarettes, coincidentally ignoring the four studies that listed 1-14 as well as the clarification that would have been given from glancing into Prescott 1998. Maybe whoever calculated the lnOR for the smoking review was partaking in an adjacent smoking habit that day. Maybe in the 13+ years since this paper was published and propagated, nobody ever bothered to once double-check the veracity of this statistic. Or maybe, just maybe, people knew or discovered at some point that this was false as decided just to stay silent.
It doesn’t matter if this was all the fault of some graduate student who took one shortcut too many, the lion’s share of the responsibility falls on the original authors of the 2010 article: Holt-Lunstad, Smith and Layton. Holt-Lunstad in particular has been the biggest flagbearer of these results, showcasing it both on her website and in a 2021 TEDx talk she gave at her institution, Brigham Young University.

Even on her website, where she subtly notes that some republications of the 15 cigarettes comparison have taken the statistic out of proportion, she makes additional erroneous claims about her own work. The notion that the 1-14 daily cigarettes bin represented moderate levels of daily smoking is outright false, as the comparison was demonstrably done to light smoking. Yet another exaggeration to add the the growing piles of falsity.
The real kicker is that the two are not even comparable since smoking is unequivocally more dangerous. The average amount of cigarettes smoked a day in the US in 2012 was 22.5, significantly higher than the 14 at the center of this discussion. What is true is that in 2010, 58.9% of US smokers fell into the 1-14 cigarettes per day bin, but you obviously can’t cut out the other 41.1% because it’s expedient.
Furthermore, she seems to be conflating her work in the 2010 meta-analysis with her work in the 2017 paper, because the language of “lacking social connection” is wholly absent from the original source, the 2010 review, as her works did not standardize the social connection nomenclature until the 2017 paper. And while Holt-Lunstad has been fairly consistent in her wording, which is still incorrect, her peers have been far less stringent.

In her TEDx talk, Holt-Lunstad features a social media post from Vivek Murthy butchering the original statement to support to her claim that “lacking social connections carries a risk similar to smoking up to 15 cigarettes per day”. What’s extra weird is that Murthy implicitly lists his sources as the 2010 and 2015 studies that Holt-Lunstad lead as discussed previously, forgetting that any other authors were attached to those papers. The 2010 Holt-Lunstad et al. meta-analysis is obvious, but why the 2015 review? Perhaps the social isolation he speaks of in the post references the results from the 2015 paper, but as mentioned prior, the OR (lnOR) of social isolation from that paper was 1.29 (0.255), making those results even less comparable than the overall findings from the 2010 paper which were not even comparable to begin with.
Of course, this is far from the first time Murthy has liberalized the comparison. After all, his 2017 Harvard Business Review article penned the inciting “Loneliness and weak social connections are associated with a reduction in lifespan similar to that caused by smoking 15 cigarettes a day”. And that wasn’t the only liberty he took with truth in that article, having asserted that “over 40% of adults in America report feeling lonely” despite the fact that a cursory look into the link he provides reveals that the report found the number to be around 35%5.


In his 2023 advisory, Murthy is certainly much more careful with his words, transforming his original line about the 15 cigarettes into the much more tepid “Lacking social connection is as dangerous as smoking up to 15 cigarettes a day”. Outside of his advisory, Murthy has been even more wary with his wording, opting to use the phrase “smoking daily” instead of adhering to the false 15 cigarettes, although those are very much still prevalent in the paraphernalia of the advisory as seen in the opening image of this article pulled from the U.S. Department of Health and Human Services. Maybe Murthy just decided to be more considerate with his wording, or perhaps something has changed to make him aware or inform him of the falsehood this comparison truly is.

Holt-Lunstad severed as the lead science editor for Murthy’s 2023 advisory on loneliness, clearly having brought her baggage with her. It’s unclear whether the misrepresentation of the 15 cigarettes comparison that ended up in the advisory was her doing or Murthy’s, or both, but the responsibility of such a decision shouldn’t elude either.
The most troubling dilemma comes when you ask how this mountain of errors and lies could have persisted for nearly 15 years. Because the most apparent outcomes is that this was born out of incompetence, whereby the highly decorated and accomplished scientists involved suffer from convenient spontaneous bouts of illiteracy, or that this arose from malevolence, lying about results or covering up mistakes for personal gain.
Unfortunately, Occam’s razor seems to triumph Hanlon’s in this instance, as from the nature of some of the errors it is hard to dismiss the notion that ill will is wholly absent. It could also explain the redress of the wording and prevaricating whenever the subject is brought up, never opting to correct the various misspeaks.
Holt-Lunstad deserves the lion’s share of the responsibility for sure, having been involved at nearly every level at which falsehoods can be found. Murthy would hold the second-most, for all his reckless pronouncements over the comparison across the last few years in addition to being the chief authority and greenlighting its altered inclusion into the 2023 advisory. Up next would be those involved in the original paper as well as authors and reviewers of its subsequent publications, with the bottom-feeders of this responsibility food chain being the dozens of journalists that chose to engage in the act of repeating instead of reporting.
Now it is important to note that none of this disqualifies the other solid work done in the rest of Murthy and Holt-Lunstad’s portfolios, nor does it negate the overwhelming evidence that widespread loneliness is very much a pressing issue. But that’s not grounds to mercilessly lie and exaggerate a threat that is already large enough. No excuse to discard the cigarette in the hand for the up to 15 cigarettes in the bush.
It’s no secret that trust in public health and science is shattering, in no small part due to the COVID-19 response, with a poll from Pew Research Center last autumn indicating that only 57% of Americans think that science has a net positive effect on society, down significantly from the 73% it stood at in the beginning of 2019.
But the most insightful takeaway on both the now unequivocable apocryphal 15 cigarettes and the state of public trust towards the scientific community comes from Holt-Lunstad herself, in a response she gave at Harvard University during the Q&A portion of her presentation on loneliness and social connection.
Question: … what’s your sense of whether the media is doing the best job possible in taking science and making that information available effectively? Or are there other things the media can be doing, other strategies and so on?
Holt-Lunstad: Yeah, I mean the media, I think, plays an important role because that’s where most people get there information. […] And of course, there’s also a role in terms of-of shaping awareness as well as shaping some of those norms, because what gets repeated often is often what’s viewed to be most important as-as well as somewhat of a reflection of what is concerning to the general public. And like it or not, it’s also a significant influence on our politicians and leaders that often make really important decisions on our behalf.
Everything Holt-Lunstad said in that response is undeniably correct. Not everyone is going to spend what little spare time they have to dig into 82 pages of scientific jargon when an article or short headline could suffice. Repetition and prevalence is sometimes used as a proxy for truthfulness, as documented by the illusory truth effect. And politicians have been influenced by the reporting on loneliness, with the 15 cigarettes finding their way into U.S. Senator Tim Scott’s (R-S.C.) committee remarks on senior mental health.
One can’t help but feel that some of trust towards public health lost over the past 5 years was deservedly so. Especially when deceptions like these are brazenly perpetrated en masse by an establishment who frequently conflates authority with prestige. And it will be difficult for these prideful figures and institutions moving forwards to recoup this lost trust if they continue to refuse to accept the simple truth: Trust is not owed. Trust is earned.
Thank you for making it all the way to the end of the article! Hopefully it wasn’t too challenging of a read. This one was especially a momentous challenge for us to both research and write. If you enjoyed it or found it insightful, do consider subscribing, commenting or sharing. Every bit of support encourages us to improve our quantity and quality of production.
So to counteract our fairly dry writing style that is often devoid of personality we thought we might do something more personable so that we don’t just come across as unfeeling androids that scour through dozens of pages of scientific reports and learn LaTeX (at least one of us) for fun.
And so that christens the practice of sharing some media that we find to be noteworthy, or at least got us through the writing process. If not also with secondary aim of showcasing underrated talent in hopes of widening the tastes of others.
Up first is I N V I S I B L E, the sophomore album from singer-songwriter and producer Vorsa, delivering a selection of somber alternative pop tracks with a fantastic blend of acoustic and electronic production in addition to the thematic pinches of angst Vorsa is best known for.
And as a single track, we felt that windflower by artists shameless. and viznode was too astonishing of a track to go unmentioned. From captivating harmonies to gorgeous textures that brighten the soul, windflower delivers all the emotional impact of life-changing journey in just a single track.
Anyways, that does it for us, this article is already long enough as is. Once again thanks for taking your precious time to read our articles and support us. We will be back soon with a more digestible story in the same field. Until next time.
Anyone familiar with gambling or games of chance should be aware of odds, the ratio of the probability of the event occurring (p) and the probability that the event does not occur (1-p).
Now the probability of a rolling any particular face of a dodecahedron, the 12-sided die, is 1/12 = 0.083 whereas the odds are 1/11 = 0.091. The probability of rolling a prime number, one of either 2, 3, 5, 7, or 11 is 5/12 = 0.417, corresponding to an odds of 5:7 = 0.714. The observation that the larger p is, the more the odds diverge from the probability, is an important one to keep in the back of your mind.
If you were asked what were the odds of rolling a prime number on an icosahedron, or maybe the familiar d20, over a dodecahedron, how would you calculate that? Quite simply you would take odds of rolling a prime with a d20 and divide them by your odds rolling a prime with the d12. Hence you are taking the ratio of the odds, otherwise known as the odds ratio.
So in the case of the presented example:
Because the OR came back to be under 1, which is what was expected considering that the odds of rolling prime on a d20 were 8/12 = 2/3 = 0.667, lower than the 0.714 odds for the d12.
The OR can also be used to interpret the percent change in the odds of an event versus a standard, with the percentage change simply being OR - 1. An OR of 1 indicates that there is no change in the odds, while an OR greater than 1 indicates a increase in the odds of the event happening, and and Or less than 1 does the inverse. In this case, the odds or rolling a prime using a d20 over a d12 decreased resulted in a 6.67% decrease in odds than in the d12 was rolled.
Suppose the aim was now to find the odds of rolling a prime with a d12 over the d20. Rather than toiling through the whole calculation again, one can quickly find the solution by taking advantage of ratios being symmetrical by their inverse.
So using a d12 increases the odds of rolling a prime about 7.14% over using a d20. Now the percent change is not inversely symmetrical, but it is unimportant given how trivial it is to calculate.
But this is not the only type of symmetry the OR possess. It is also symmetrical by the inverse of the opposite outcome. In this example, the opposite outcome would be the odds of rolling a nonprime with a d20 over rolling the nonprime with a d12, and so the inverse would simply be the odds of rolling a nonprime with the d12 over rolling it with the d20.
The symmetry doesn’t stop there, in fact it is even present for entirely different ORs in the same environment. Take for instance a new problem: what are the odds of the number shown on a die to be not only prime, but also from a d12? Assuming that both the d12 and d20 have a 50% chance of being cast. The probability of the prime being from the d20 is 8/13, given that there are 13 primes total. Conversely, the probability of rolling a number that is not a prime on the d20 is 12/19.
This utility is a fundamental feature of the OR.
As stated in the main body of the text, the log-transformation is used to make a distribution more normal to allow for parametric testing. It can also be used to make data more visible by clustering disparate date while still preserving order and some magnitude. Calculating the natural logarithm of the OR for rolling a prime on a d20 over a d12 is straightforward.
The lnOR can allow for a more clear-cut interpretation of the change in odds, with negative and positive values of the lnOR corresponding to a relative decrease and increase, respectively, of odds. Zero in this case corresponds to no change in odds.
Now to find the inverse, rather the lnOR for rolling a prime on a d12 over a d20, one could take the natural logarithm of the inverse OR, 1.07, but a key property of logarithm makes the calculation even easier.
This makes this finding the lnOR of the inverse event effortless.
This arguably gives the lnOR a greater degree of flexibility than the OR itself because finding the calculation for the inverse odds only involves a swapping of signs. Despite not conveying the percentage change in odds as easily as the OR, the magnitude of the lnOR is still a fairly faithful indicator of the change in odds, and its properties make it an attractive way to represent good fits for the OR, such as mortality: odds of being dead vs. being not dead.
The RR, being the relative risk, or risk ratio, represents the ratio of two risks, obviously, but what exactly is risk? Well risk is another term for probability, or p as seen before and previously used. So as follows:
And to quickly go back to the example or rolling a prime on a d20 over a d12:
The RR can very much be interpreted in the same way as the OR, except that the percentage change it represents is that of risk and not odds. So taking RR - 1 informs you that the risk, or chance, or rolling a prime with a d20 is 4% lower than rolling with a d12. So what happens when, as with the OR, you take the RR of the inverse of the opposite outcome?
Beyond the symmetry it has with its log-transformation, the RR does not possess the intrinsic levels of symmetry that the OR has.
In situations where the risk of the target event is low, then the odds will start to approximate risk.
By extension:
Now the other big difference between the OR and the RR comes down to their use cases. Two main types of epidemiological methodologies include the cohort and case-control studies. The cohort study takes a look at two groups, exposing them each to different conditions. The case-control study looks at two conditions, and works backwards to determine the two groups.
As a relevant example, a cohort study would investigate the effect of smoking on lung cancer by measuring the rates by which smokers and nonsmokers develop lung cancer over the duration of the study. This is a situation where the RR is preferable to the OR since the risk of getting lung cancer can be determined and contrasted for both the smoking and nonsmoking groups.
The case-control study alternative would start with by looking at people with and without lung cancer, measuring the smoking habits of each group to determine the odds of getting lung cancer being a smoker or a nonsmoker. Since the risk of getting lung cancer cannot be ascertained here, the OR is the optimal choice.
Further explanation, more visual explanation at that too, can be found here.
A calculation sex-weighed study by sample size follows:
Calculating this with all five studies gives:
Given that the Al-dalaimy 2001 and Doll 2004 studies only look at one sex each and that Bronnum-Hansen was equally split in two.
As one can see, this clearly falls short of the value displayed in the discussion figure, but if one were to drop the flagging Bronnum-Hansen study:
Taking this to its end:
Now it is important to reflect on the role that conformation bias plays into speculations like these. After all, if you are looking to to obtain a certain result, you have to be vigilant about the various creative shortcuts that get you there.
That being said it is effectively unequivocable from the disparity in results reported by Holt-Lunstad et al. and Shavelle et al. that something is afoot, what that something is, precisely, is the topic of the speculation. But that’s effectively the explanation for a sex-weighted average approach, one speculative method that tries to collate the male and female results.
A possible alternative speculation for the calculation behind the lnOR for the < 15 cigarettes is the that Holt-Lunstad et al. used weight based averages for each sex. In the table provided by Shavelle et al., they gave each study a corresponding weight that was used to calculate their overall averages. Sub-setting for just the < 15 cigarettes for males gives:
Substituting:
And for females:
And substituting again:
Now coercing them to lnOR values for these averages made using weights provided by Shavelle et al. are 0.499 and 0.530 for male and female respectively.
The difficulty for this being a suitable explanation is that the results for male and female cannot be consolidated since the same studies involved were given different weights even when the sample size was the same. So you are stuck with two numbers, and to get where the sex-weighed average was you would have to discard the result for males.
And either way there still exists the problem of this not mapping to the displayed confidence interval, although it’s uncertain what would. The confidence intervals the discussion figure were calculated the same way the lnOR was, simply by taking the natural logarithm of the original OR interval limits.
But again, the smoking meta-analysis does not seem to follow the trend set by the other studies because going backwards from the graph to find the interval limits reveals a confidence interval that deviates ~ 3% from the OR, which is curious since the most a confidence interval deviates from the OR for any of the < 14 cigarettes studies is Doll 2004, whose interval on average deviates slightly more than 10% from the OR.
How Holt-Lunstad et al. managed to average an OR that consolidate both the data across the sexes and the different weights assigned to each study while markedly reducing the uncertainty of that average is uncertain, but if true, it would be nice to publish that methodology since the scientific community would greatly benefit from such a powerful tool.
Again to note that because Holt-Lunstad et al. did not explain this in the paper, some of holes need to be filled with speculation to draw conclusions. In fact a rough absolute measurement of the graph seems to confer a lnOR of ~ 0.531, slightly higher than either of the two speculations, but this measurement is derived from a directly measuring its relative length on the graph, which is not always wholly accurate.
It is entirely possible that Holt-Lunstad et al. asked Shavelle et al. and the various authors represented in that study for their raw data, finding errors and fixing them to report the correct result in their discussion figure. It also entirely possible that Holt-Lunstad et al. developed their own effects model by essentially running a mini-meta-analysis on their selection of smoking studies to come to the data presented. Still possible is the fact that these results were attained from another smoking meta-analysis entirely, with the Shavelle et al. citation being a holdover.
But are these alternative explanations likely? Because either way you spin it, you’re still playing outside of the takeaways provided by Shavelle et al. Not to mention that the more involved the explanation, the more egregious it becomes that no explanation was given.
While the overall rate for loneliness is 35%, age bins of 45-49 and 50-59 reported rates of 43% and 41%. The only way for Murthy’s statement to be correct is if you accept the definition of adults only as those aged 45-59, which is ridiculous to do and even more absurd to imply that’s what he meant when he said adults.
The other issue is that the report, most likely because it was commissioned by the AARP, formerly known as the American Association of Retired Persons, didn’t track loneliness rates for those under 45, of which some might be considered adults. The report was also a bit dated, having been released in 2010. When more comprehensive data came out in 2018, a year after Murthy’s article was published, loneliness rates were indeed found to have been above 40%, thanks in no small part to the despairing youth.
So even though Murthy’s claim came to pass, it was not done so by the argument he made. Reporting the weather for today as 30°C when the forecast says 25°C, and it rising to 30°C the next day does not mean you accurately predicted the weather far from it. Hilariously, that 2018 loneliness report by Cigna also echoes the “Loneliness is as deadly as smoking 15 cigarettes a day”.